Breaking free from GitHub Discussions' limitations
As I recently wrote about, we use GitHub Discussions for triaging user requests in the Renovate project.
This process works really well for the maintainers (the team who have final say on new features, and whom have merge rights) and contributors (people who regularly contribute to Renovate's features, fix bugs, improve documentation and help answer user questions), and as noted, Renovate optimises for the people who do the work, rather than for what the users would necessarily want (although we take that into account).
I'd recommend reading why we use Discussions if you want to understand more about our reasoning for Discussions instead of Issues, before going further.
One of the things that we find a little lacking is that the Discussions UI on GitHub is missing many features and views that would make it more straightforward to monitor our user requests and suggestions.
Some of these gaps are specific to us as a project and how our process works, but some seem like "low hanging fruit" that would be great for GitHub to implement on their side, but Discussions doesn't seem super invested in recently.
For instance, Discussions have a native means to vote on posts, wehre users can anonymously show interest in i.e. getting a feature implemented, or to say that they're also affected by a bug. You'd think that because votes are natively implemented in Discussions, being able to ask "what is the Discussion with the most votes on it?" would be a reasonable ask, right? Well, you cannot answer this from the web UI. To solve this, you need to reach for the API, which results in you needing to list every Discussion to get the vote count, and then work out what's highest from there, as there's no way to order by votes.
This is a simple example of some insights we want to get into our community, but it's by no means the only question we're missing the means to answer.
As a maintainer on the project, and our community manager, I'd like to see information like:
- What new Discussions are there?
- Setting up an RSS-feed-to-Slack for the GitHub Discussions works well as a starting point, but you can sometimes miss things when there's a torrent of requests coming through
- Where have we had Discussions that haven't had a reply by anyone, for some time?
- How many Discussions did we close this week/month?
- How many (possible) bugs have been reported recently?
- How many (actual) bugs have been reported recently?
- Are there any Discussions that had a bot request they provide more information, but they haven't replied since?
- As they're likely stale (but we won't close it)
- Are there any Discussions that had a bot / contributor / maintainer request they provide more information, but they have replied since?
- As they need us to follow-up on them
- Where do we have highly upvoted requests from the community?
- As we may not be focussing on things the community want/need
- What has maintainer input needed?
- Where should I or the other maintainers focus on responding to?
- Which user(s) are being the most helpful and/or answering the most questions?
- Split by the maintainers and contributors, and anyone else, who may be folks who we may want to "promote" to a contributor, if they're interested
- This data is only available for the last 30 days, but we may want to see usefulness-over-time
- Which Discussions do I need to reply to, because there hasn't yet been a contributor or maintainer review?
Unfortunately, none of this is straightforward to work out, and makes triage a little bit painful for the project.
Implementing our own tooling
Instead of being grumpy about it, I set about taking my own advice, and decided to work on fixing that for myself.

I had a long-term vision of building a maintainer-and-contributor-only web UI that folks could log into, see the various information that's relevant to us, and provide information about "which Discussions are lower priority, as another maintainer/contributor has already answered it", or "which Discussions have you replied to that have been replied to by the user".
Before I got too far in trying to design the right web interface and experience, I wanted to focus on the underlying data that we would need to ingest, as that would drive quick feedback.
Folks who've worked with me over the last ~5 years have noticed that I'll often reach for the great tool that is SQLite, and will be unsurprised to know that this was going to be no different.
By focussing on extracting the data from GitHub into the local SQLite database, this would give me the fastest feedback. I could then utilise my local workflow with SQLite, as well as allow me to use great tools like Datasette or sql-studio, to write the queries I needed, without needing to also build out the complexity of a web UI.
This would mean I could push the building of the web UI to a later point, at the point that others on the team would be wanting to use it without hand-writing SQL queries.
Hitting the API
To decide on the data model for the SQLite database, I first had to understand how GitHub's data model worked, and so spent some time exploring the GraphQL APIs available.
(Aside: I'm still sad that GitHub no longer host graphql.github.com for an interactive GraphQL browser)
Once I'd done my poking around, I set about writing a set of Go tooling to hit the GitHub API, fetch Discussion data, and sync it to the local database via sqlc.
Renovate is a very active project, with 5 years worth of Discussions data, so I had a lot of data to sync from GitHub to the local database - at least for the first time.
GitHub's rate limits seemed to agree with me:

While doing significant backfill (culminating in a ~125MB SQLite database, with ~11k Discussions and ~55k comments), I ended up repeatedly hitting GitHub's rate limits - which was very understandable!
To monitor the rate limits for each Installation of my GitHub App, I ended up writing a tool that would give me a view of how close to rate limits I was running:
As each Installation ID got close to the rate limits, I cancelled the backfill process, and I then moved to another Installation ID, until I'd completed the backfill.
At a later point, I implemented the ability to auto-rotate with Installation the GitHub App was using, so I wouldn't have to keep cancelling the process, but could instead transparently move between them.
SQLite-as-UI
With the data available, I was already able to start getting a good amount of value from interrogating the SQLite database, instead of GitHub's web UI.
For instance, my first minimal database would allow me to query "which Discussions have been closed without an answer being selected":
select
    title,
    url,
    category_name
from
    discussions
where
    (
        state = 'RESOLVED'
        or state = 'OUTDATED'
    )
    and answered_by is null
order by
    updated_at desc
This would give me the answer to a relatively straightforward query, which I also could've used the GitHub UI for.
(This specific example is more from a project hygiene basis, as it's useful to know where we've maybe missed that there was a resolution that fixed the user's request)
Using the GitHub UI would mean that I'd have to work through ~23 pages of GitHub's fairly heavy web UI to see all the results. Now, I can query that data in ~0.01s!
Let's look at some more complex queries, but for straightforward asks that are seemingly impossible to query with GitHub's UI:
-- how many open "Request Help" Discussions are there which haven't had any replies?
select
    number,
    title as title,
    url as url,
    discussions.created_at as created_at,
    discussions.updated_at
from
    discussions
    left join discussion_comments on discussion_comments.discussion_number = discussions.number
where
    (
        state = 'OPEN'
        or state = 'REOPENED'
    )
    and discussion_comments.discussion_number is null
    and category_name = 'Request Help'
group by
    discussions.number,
    discussions.created_at
order by
    discussions.created_at asc
And:
-- which "Request Help" Discussions are the highest upvoted?
select
    discussions.upvote_count,
    number,
    title as title,
    url as url,
    discussions.created_at as created_at,
    discussions.updated_at,
    count(discussion_comments.discussion_number)
from
    discussions
    left join discussion_comments on discussion_comments.discussion_number = discussions.number
where
    (
        state = 'OPEN'
        or state = 'REOPENED'
    )
    and category_name = 'Request Help'
group by
    discussions.number,
    discussions.upvote_count
order by
    discussions.upvote_count desc
In each of these cases, now we have the raw data, if I can think of a query (or ask a Large Language Model to generate a query for me) I can get the data.
That's pretty awesome.
Over time, I've added in more data, such as comments on the Discussion, the full body of the Discussion and/or comments, and the upvote count on Discussions.
This required a bit more logic, given the database already had some of the data synced, so I crafted a backfill command, which would look up what missing data may exist for a given Discussion locally, see what was available via the API, and sync it if needed.
MVP for visualisation with Evidence
As well as the raw queries I was writing, I was yearning for a little bit of visualisation for things like "how many new Discussions were raised", as well as a way to have some pre-canned queries I could reload the data for.
I've written about loving Evidence for data visualisation before (including having GPT-4.1 write me a Neovim plugin), and so I reached for it again as a MVP for a UI, before needing to build my own.
Adding Evidence into the mix allowed me to start building visualisations of data.
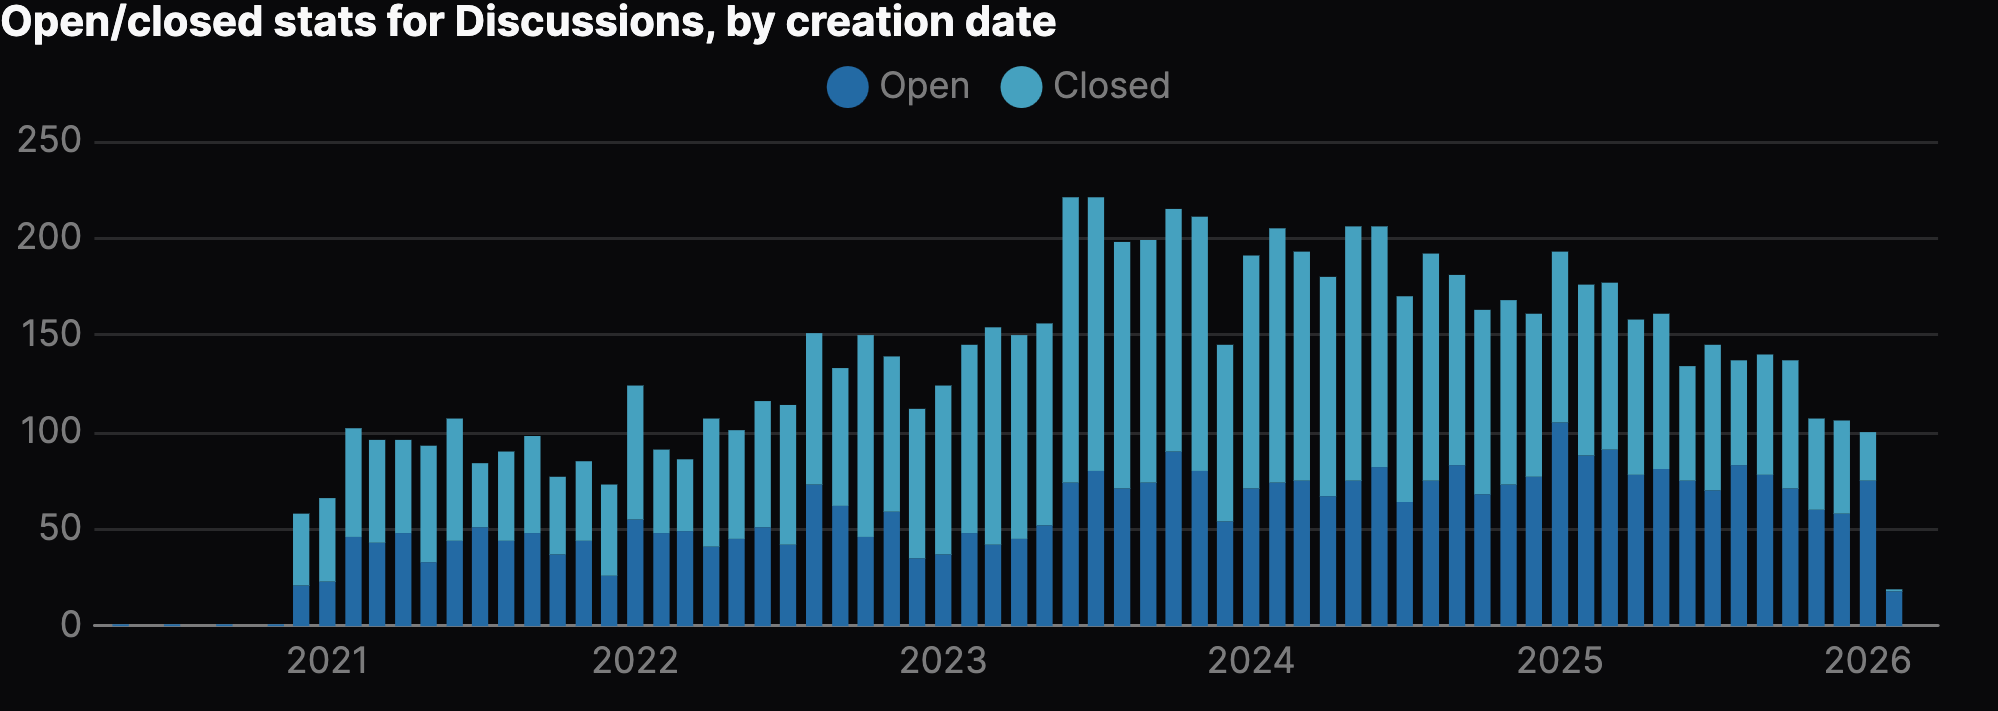
In particular, I wanted to visualise how many Discussions we had, based on when they were created:
When looking at this graph, it's also useful to compare this to how many we've closed over time:
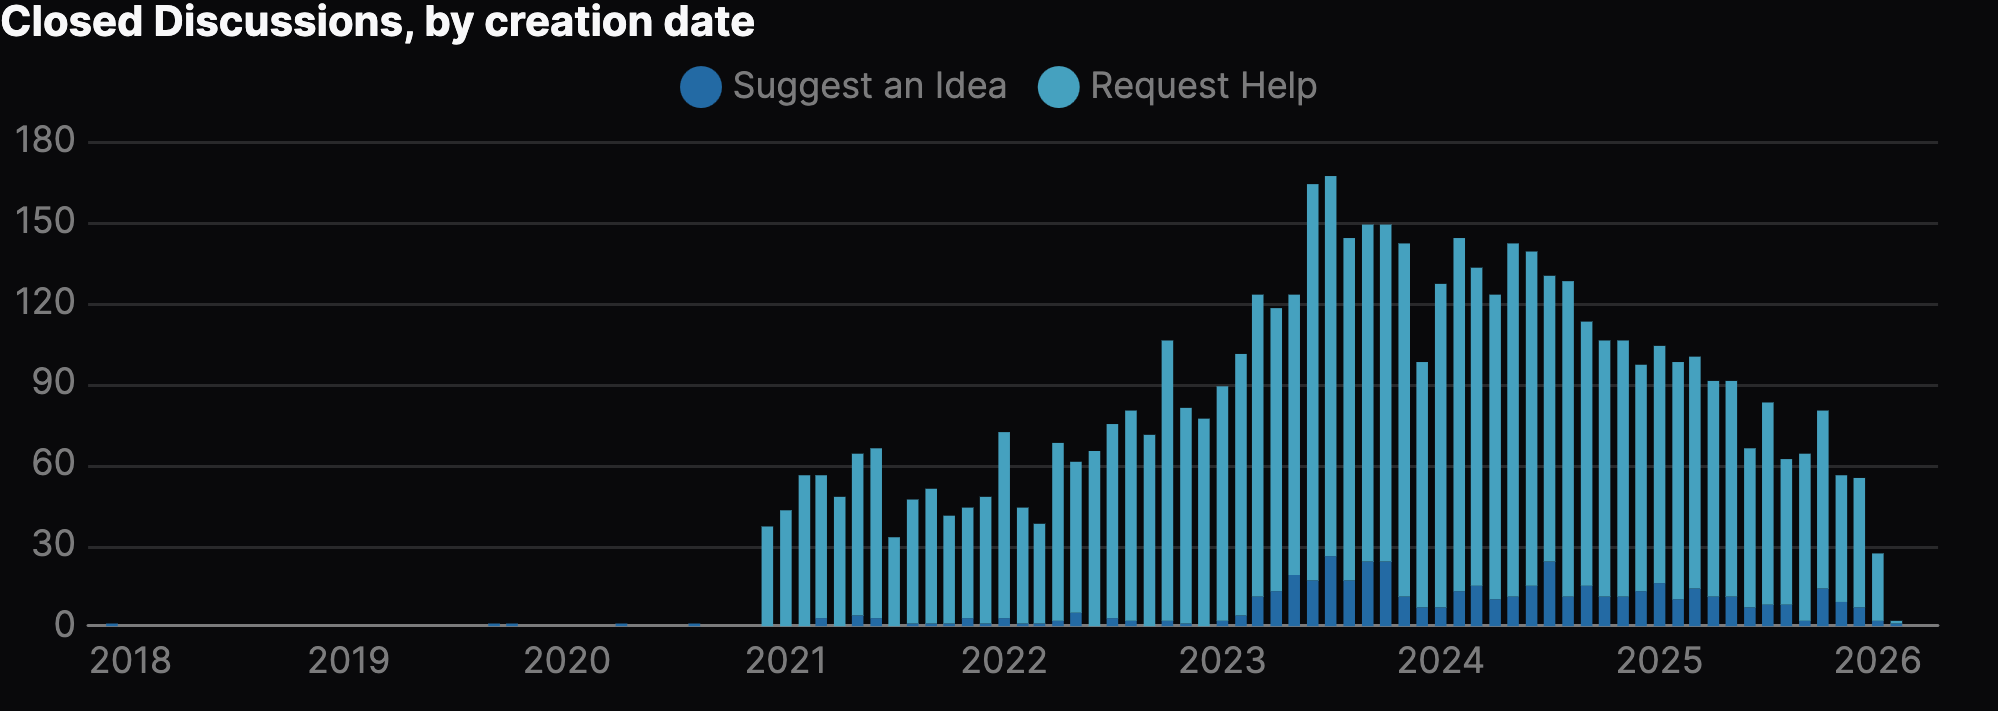
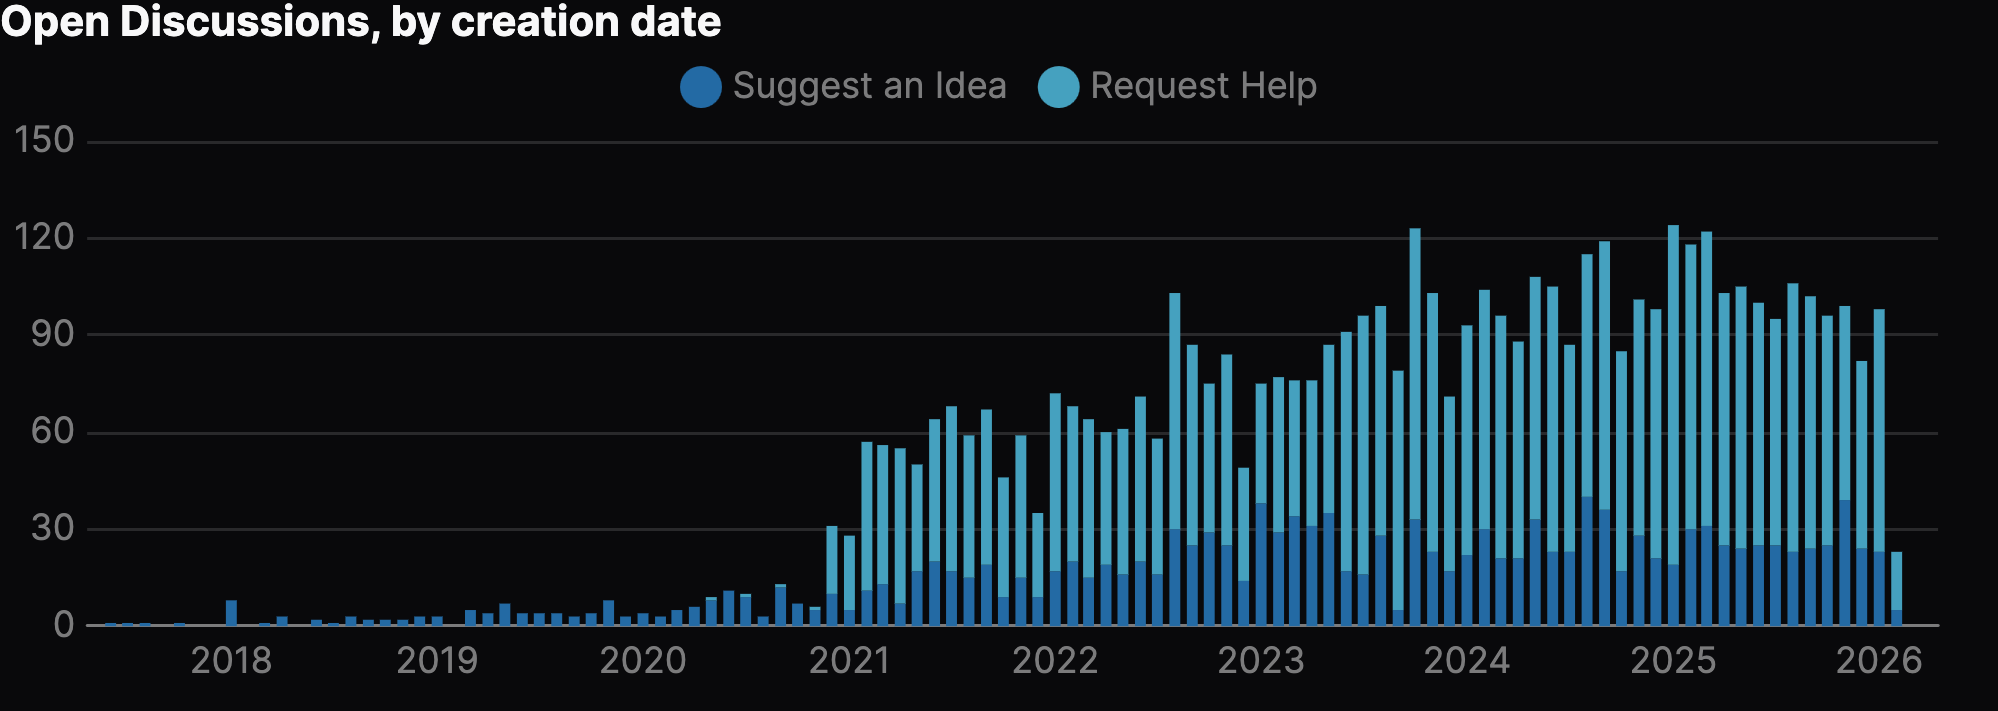
We can also see this on a per-category basis with open/close stats over time, for instance with the "Request Help" category:
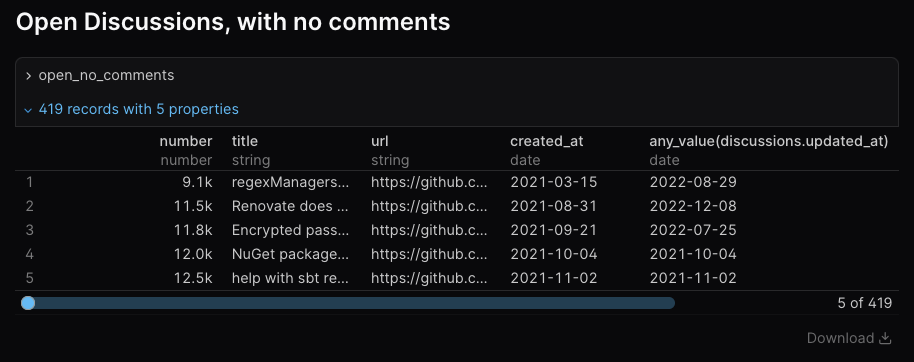
These visualisations are very useful, but I've found that for daily triage work, creating purely table-based rendering of the data has been enough:
This may be all the UI we need for some time - it provides ways of rendering commonly needed queries, visualising data in interesting ways, and if we wanted to, we could deploy this to a (private) GitHub Pages deployment, so only maintainers and contributors could access it.
Open Source
Update 2026-03-25: This is now Open Source.
The project will be Open Source soon. I need to finish cleaning up some Git commit history - as I've not been as focussed on making sure my commit messages are perfect, but general snapshots after implementing something - before it's open to the world, but it's the plan.
The project will be available under the AGPL-3.0-only, as Renovate is, and I hope it will be useful for others to look at.
What did I learn?
I don't think these are going to be particularly surprising to anyone who's been building software for years, but I thought it's worth re-stating some lessons I've reminded myself of, while I've been building this.
Optimise for fast feedback
When building something like this, getting an indication early on of whether this is going to be useful is very important.
Iterating quickly to build out the data model, get a chance to play with some of the queries, and then add more data or functionality was important, and helped confirm the utility of the work.
Now, I could have also got other maintainers and contributors to test drive it to get additional feedback, but given the majority of this work is done by me and one other, I decided to focus on what key requirements I wanted to fulfill before it went out to others.
MVP → MVP → MVP
Focussing on smaller iterations of the Minimum Viable Product provided value in iterations, where instead of trying to build the final web UI, I focussed on SQLite as the interface.
Then, when I needed a little more, I used Evidence as the web UI.
If I'd aimed for the web UI as my primary focus, I'd still be building it, and getting no value 😅
It might be we never need to move on from Evidence, as it gives us exactly what we need, which allows us to focus on the important work - helping Renovate users! - rather than building a new web UI to replace the current web UI we have.
Large Language Models have been useful
I'm a self-described "cautious skeptic" of AI, and I'm trying to do more with AI where makes sense.
This project has been a great opportunity to try and push them a little more than I have in the past, especially as this effectively a side project I've been working on alongside my other work. Being able to push it forwards with a bit of outsourcing to an LLM has been useful, and it's helped me ship a little bit quicker than I would have otherwise.
LLMs have not only been useful for writing the underlying Go code to query and sync data from GitHub to my SQLite database, but it's also been useful with writing queries.
It's been really fun pointing crush to my SQLite database, and watching it work out how to find an answer for me. Although some of these more complex queries are things I could've written, it's been nice to parallelise myself, allowing the LLM to go and write the query, while I can focus on something else.
In particular, when using Evidence, a slight rough edge is that it uses DuckDB's SQL syntax, which means that some SQLite queries I can write won't run in Evidence. It's been useful to outsource this to the LLM, who can then convert it for me.
Was it worth it?
Maybe burying the lede a little bit, but yes, it was absolutely worth it.
Even if it's only used by me, it's provided a huge amount of value since starting the project in January.
At the start of each day, I'll come in, sync the latest changes from GitHub, and see what I need to go and triage. This is a much more useful process than opening the GitHub UI, and trying to work out where things are at.
I'm hoping that this will also be useful for the other maintainers and contributors. So far, I've not shared it with them, mostly out of commit history shame 😹 I'm wanting to make sure that I can share it when it's ready for them to be able to pull and start using (without the risk of me force-pushing over changes.
I'm hoping that some of these insights come to GitHub's UI, but until then, we've got our own control over improvements and insights that will make the experience better for us and our users!