Creating beautiful visualisations of dependency data with Evidence
In a couple of weeks I'm speaking at GopherCon UK 2025, where I'll be facilitating a tutorial What story does your dependency tree tell you about your organisation?.
(This would also be described as a "workshop", but GopherCon UK runs both "workshops" and "tutorials" - the former is a pre-conference, all-day training, whereas "tutorials" are during the conference and last 2 hours)
As I write this post, I'm on my way back from Manchester, where I presented a sneak peek of the tutorial at the Manchester Gophers, which I was looking forward to and had a great time at - thanks everyone for coming!
One of the key decisions I've made with the workshop-style session is that I want folks to be able to rock up without a laptop, or without being able to use their company's data, or join part way through the workshop, and still get value.
Although the hope is that folks will have done some of the pre-setup, it's also very possible that folks won't necessarily have and that if I can cater towards that, it'll make it more approachable.
Doing this has required me to rethink a few of the "basics" of how the workshop is structured, and changes what sorts of things I need to prepare ahead-of-time, as well as consider what will be happening live during the workshop.
(I even ended up revisiting a very old post of mine, Preparing a Technical Workshop - A Checklist)
As part of planning, I knew that I wanted attendees to have a view of the data, hosted on the web, which could provide some pre-baked queries and present it in a format at least one level above the default sqlite3 output.
There is already an example web application for Dependency Management Data, and although that was an option for presenting the data in a reasonable way, I also wanted to explore more options.
One of the options, Evidence.dev, jumped out at me - especially as something that's been on my radar since June last year - as a data visualisation toolkit that can work with SQLite databases, and provide nice rendering + visualisation.
Over the last couple of months, I've been working on using Evidence at work to "kick the tyres" and understand exactly what's possible with it, and I'm really happy with what I've been able to do with it - and hope other users of Dependency Management Data will too!
What's Evidence?
Evidence.dev is an Open Source data visualisation toolkit that makes it straightforward to take various datasources and create rich visualisations based on SQL queries.
There is a hosted platform, and an editor (Evidence Studio), but I've - naturally - focussed on using the Open Source tooling as a way of understanding its applicability.
For Dependency Management Data's use cases, Evidence allows you to plug in DMD's SQLite database, perform mappings for each of the tables that you want to read from (known as "source queries"), and then in Markdown can start authoring queries to be visualised.
One of the huge selling points for me was that it allows writing plain Markdown, with SQL in Markdown code blocks that then render live.
You can then add on top additional was of representing that data, but even if "all" you want is the plain queries, that's all you need to do.
But Evidence makes it very handy to plug different visualisations (pie charts, bar charts, table rendering, etc) into the Markdown via a Web Component.
Another key selling point is that it compiles down to a static website (with client-side Javascript to render the data), allowing you to develop locally and then push to an accessible location for others.
Importantly, this static website is also a nicely responsive site, so you can browse from a mobile device, and still read the graphs and understand what's going on.
Gaining familiarity
Before I got to the point that I could write a glowing review of it, I needed to get some familiarity with Evidence, how it interacted with the data and whether it would be applicable for my workshop, as well as maybe some wider usages.
This has largely involved looking at how I could use Evidence with some of our internal usage of Dependency Management Data at work, taking some of the "common queries" that we have in a wiki page, and presenting them in a better way than "click this link and get an output of rows".
On top of this, I wanted to really test out some of the visualisation components, to see how they worked, and whether they could provide better representations of data.
For instance, in October I was doing a presentation to my leadership about some insights that involved a lot of data derived from DMD. As part of the prep for this presentation, I:
- thought about what would be interesting insights
- wrote some SQL to capture that
- took the output of that query's results and put it into Google Sheets
- created a chart in Google Sheets to visualise it
- pasted that chart into Google Slides, as a linked object, so I could update it in Google Sheets and it'd update in Google Slides
As you can expect, this was a bit cumbersome and repetitive.
So one opportunity I've taken as part of testing out Evidence is how to convert that whole set of slides to using Evidence, in a way that provides the same visualisation, but now is in-sync with the data in the database.
With our deployment of Evidence at work, we've also got:
- per-team views of "here are your public repo advisories" or "which Important Packages are out-of-date", or "you have an upcoming end-of-life date"
- per-business-unit views of similar data, with more of an "executive view" feel
- visualisation of some of our common internal queries, but now more accessible and pre-rendered
Setting up evidence
So how would you go about setting up Evidence for Dependency Management Data?
- Follow the Install Evidence docs (using
npx degitworks nicely) - Follow the Build Your First App docs to set up your datasource, pointed to your Dependency Management Data SQLite database.
Creating some queries
To start with, we could look at listing information about the Dependency Management Data database we're working with.
Let's say we have pages/index.md:
---
---

```sql meta
select
    *
from
    metadata
```

```sql count_datasources
-- NOTE that this is intended to be used with a pie chart, which expects `name` and `value` as column names
select
    '# Renovate' as name,
    count(*) as value
from
    renovate
union
select
    '# SBOMs' as name,
    count(*) as value
from
    sboms
```
To get this working, we also need to define the following source queries. Assuming that the datasource you configured earlier is called dmd, we would need to define the following files, for Evidence to determine the tables we want to source data from:
-- sources/dmd/metadata.sql
select
    *
from
    metadata;
-- sources/dmd/renovate.sql
select
    *
from
    renovate;
-- sources/dmd/sboms.sql
select
    *
from
    sboms;
From here, this will render the row results inline (when showing queries), but it'd be nice to render them more visually.
Visualising those queries
---
---

```sql meta
select
    *
from
    metadata
```

<DataTable data={meta} />

```sql count_datasources
-- NOTE that this is intended to be used with a pie chart, which expects `name` and `value` as column names
select
    '# Renovate' as name,
    count(*) as value
from
    renovate
union
select
    '# SBOMs' as name,
    count(*) as value
from
    sboms
```

<ECharts config={
    {
        series: [
        {
          type: 'pie',
          data: [...count_datasources],
        },
      ],
    }
}
/>
With this set, we can now see a table and a pie chart rendered - great!
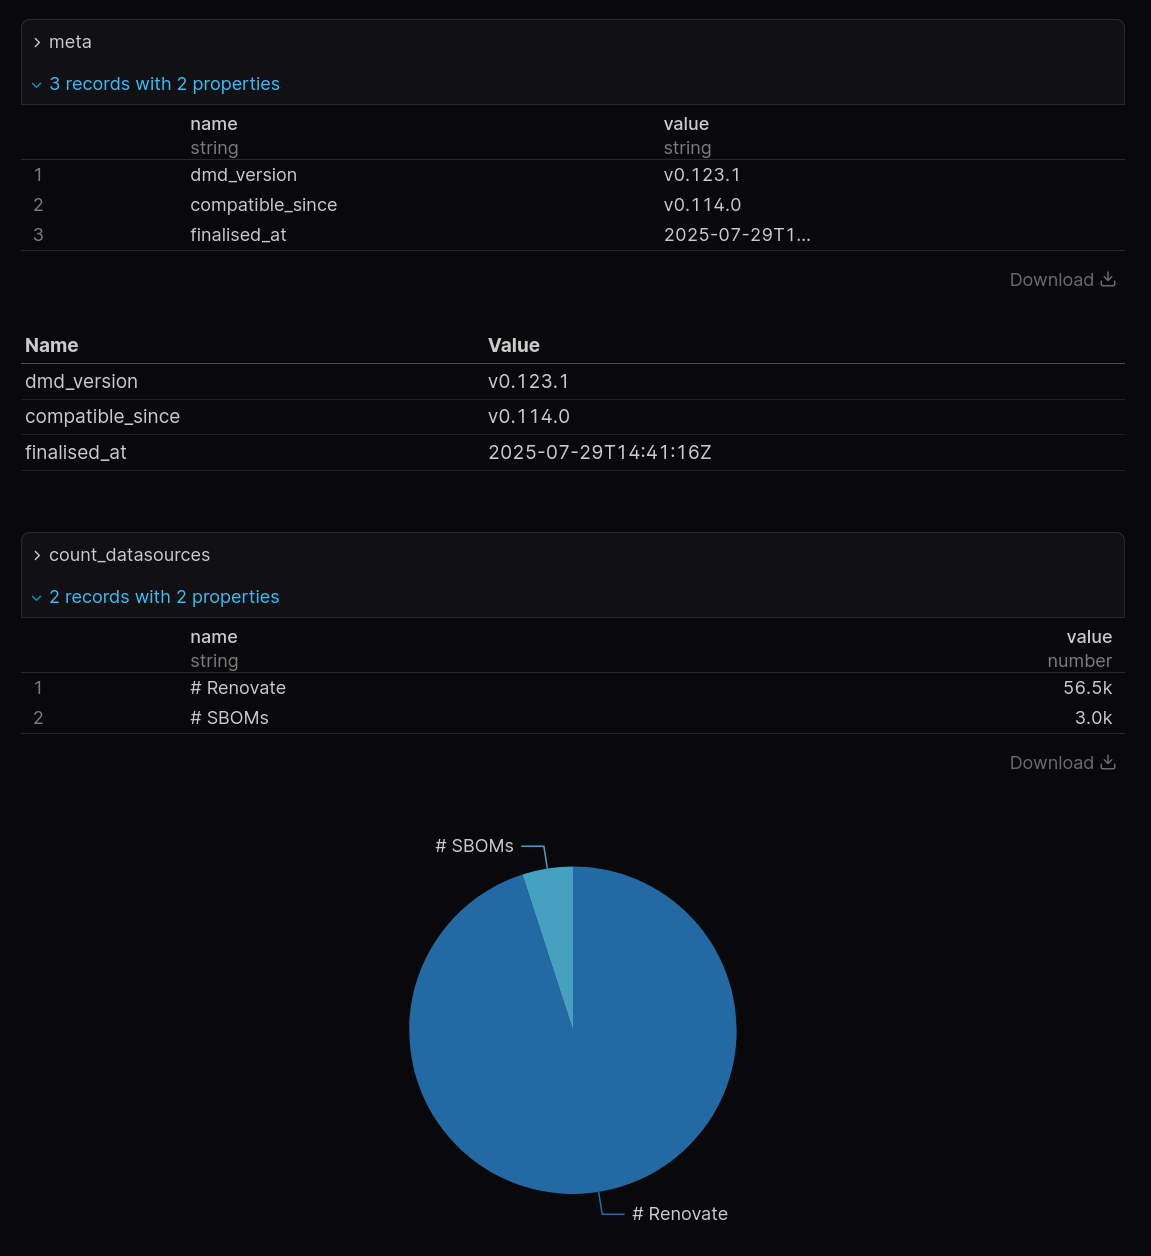
This is a simple example to show how this can be used, but I'm sure it leaves you wanting more.
In-depth examples and visualisation
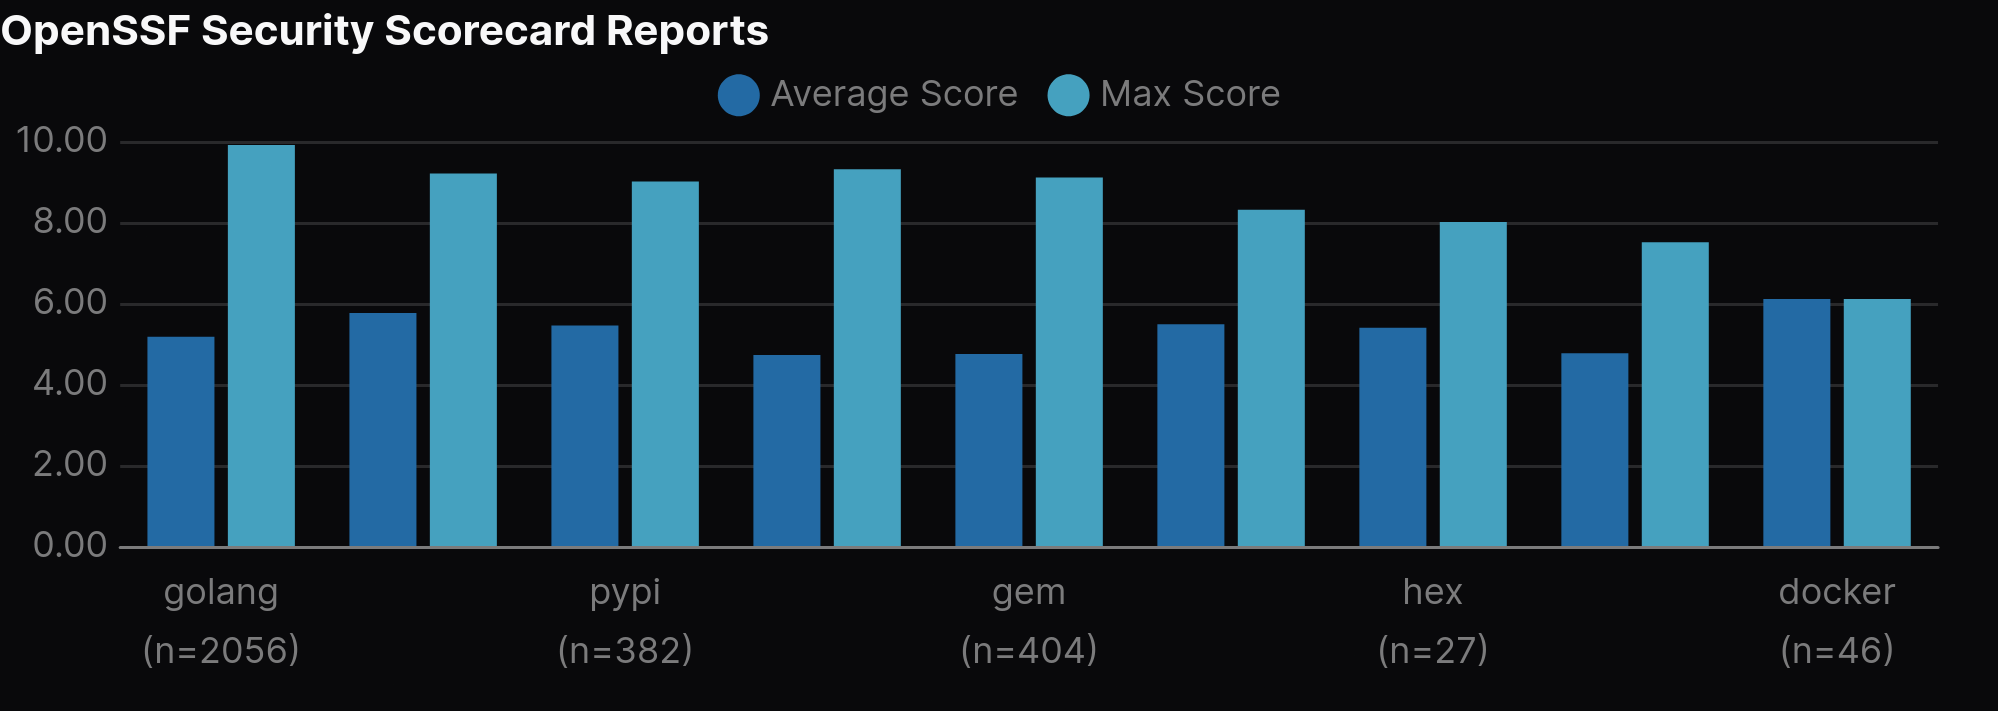
You can see a more in-depth view of some of the insights you can get from the data on the GopherCon UK 2025 companion app, and the corresponding code on GitHub.com.
For instance:
As you will see, there are some good visualisations in there, as well as interesting queries digging into certain views of the data that may be interesting to your organisation.
This will likely change a bit over the next couple of weeks, and medium-term, I'm planning on having a separate site for the DMD example data which will be updated alongside the database itself (weekly on a Thursday).
Some learnings I've found while working with Evidence
A few key things I've found when working with Evidence:
- The SQL queries you execute must be in DuckDB syntax, as they are executed in-browser by a WebAssembly DuckDB client
- This does mean, however, that you can't always directly take SQLite queries and run them in Evidence, and vice versa
- The Evidence community Slack is (unfortunately) the quickest way of getting support from Evidence staff, as the Open Source project is currently not seeing much engagement
- I've (well, mostly GPT-4.1 with some help from me) created a lightweight Neovim plugin that makes it nicer to author Evidence Markdown, giving some autocomplete for
data={...}definitions or auto-formatting SQL inside code blocks for consistency - I'm still a bit of a basic bitch with how I do visualisation - leaning on Bar and Pie charts, and I need to learn about some more data science and visualisation!