Lessons learned adding OpenTelemetry to a (Cobra) command-line Go tool

In an effort to better understand + instrument tools I work on (both in and out of work) I've recently been introducing OpenTelemetry support to Dependency Management Data.
This is something that I've been meaning to do for a while, and as part of looking to do some telemetry setup for a CLI at work (which also uses Cobra under the hood) I wanted to take the opportunity to test this with dependency-management-data.
I thought I'd write up my experiences with it, generally as a form of blogumentation, but also as there are a couple of pieces I'd welcome feedback on.
I'll note that this is a bit of a different experience for me - not only is it the first time I'm "properly" setting up telemetry, where I don't have existing libraries or best practices to rely upon, like I have at previous instances of instrumenting applications for observability.
Additionally, the intent of this telemetry is for any operator of Dependency Management Data to gain insight into how the dmd CLI runs, so it needs to be a bit more generic and broad in insights it can bring.
Why OpenTelemetry?
OpenTelemetry (aka OTel) is an open standard for providing common tooling and protocols for observability data.
As I work at one of the observability vendors, Elastic, we've naturally got a lot of investment in making sure our products work well with OTel, including recommending the OTel Go SDK over Elastic's!
As I've not worked with OTel before, I thought this would be a great opportunity to get a bit more hands-on with it.
Setting up OTel with Cobra
Update 2024-11-29: It's worth reading Gotcha: PersistentPostRunE only runs on successful commands in Cobra, this has been updated to use OnFinalize.
As mentioned above, I'm using the excellent Cobra framework for building the dmd command-line tool.
Looking around, I wasn't able to find a good guide into how to start with adding OTel into my Cobra CLI, so through a few bits of trial-and-error, I've settled on the following setup.
The command we're instrumenting, dmd, has a number of subcommands, so we want to make sure that children of our rootCmd are all automagically instrumented:
var (
	otelShutdown func(context.Context) error
	 // cmdSpan is the currently processing `cobra.Command`'s Span
	cmdSpan trace.Span
	// cmdSpan is the currently processing `cobra.Command`'s Context, needed for the `OnFinalize`
	cmdContext context.Context

)

var tracer = otel.Tracer("dmd.tanna.dev/cmd/dmd")

var rootCmd = &cobra.Command{
	// ...
	PersistentPreRunE: func(cmd *cobra.Command, args []string) error {
		// ...

		shutdown, err := tracing.SetupOTelSDK(cmd.Context(), tracing.CommandDMD, versionInfo.short)
		if err != nil {
			return fmt.Errorf("failed to set up OpenTelemetry: %w", err)
		}

		otelShutdown = shutdown

		// wrap the whole command in a Span
		ctx, span := tracing.StartSpanForCommand(tracer, cmd)
		cmd.SetContext(ctx)
		cmdSpan = span
		cmdContext = cmd.Context()

		return nil
	},
	// as per https://www.jvt.me/posts/2024/11/29/gotcha-cobra-persistentpostrune/ we can't use a `PersistentPostRunE`
}

func init() {
	// as per https://www.jvt.me/posts/2024/11/29/gotcha-cobra-persistentpostrune/ we can't use a `PersistentPostRunE`
	cobra.OnFinalize(func() {
		// and then make sure it's ended
		cmdSpan.SpanContext()
		cmdSpan.End()

		if otelShutdown != nil {
			err := otelShutdown(cmdContext)
			if err != nil {
				// we don't want to fail the process if telemetry can't be sent
				logger.Error("Failed to shut down OpenTelemetry", "err", err)
			}
		}
	})
By setting this up as a PersistentPreRunE and OnFinalize, we will make sure that these pieces of code run for all nested commands.
This then calls out to a function, StartSpanForCommand, which creates a new Span from our tracer, and injects any command-level attributes that may be useful, and then makes sure the new context.Context is set in the cobra.Command, to ensure that it's the new child context.
Lessons learned
Use consistent http.Clients
This is a fairly reasonable, and probably "table stakes" idea, but you should use the same HTTP client everywhere, or clients that are set up in a consistent way and can have common http.Transports and other tracing functionality embedded, rather than using different/http.DefaultClients in different places.
Make sure you're passing context.Contexts everywhere
Similar to the above, this is something that is similarly fairly standard across Go applications, but there were a few places in the codebase that didn't actually pass around context.Contexts, as they didn't make use of it.
Either as I came to start creating a child Span, which needed a context.Context, or I found that i.e. an HTTP call wasn't represented in a parent Span, I would need to make sure the context.Context was passed around.
To make the work easier, I performed a prefactor which was reasonable to do up front, across the various parts of the application, making sure that things that could take a context.Context would be given one.
As I mention, this is the sort of thing that "should" already being done, but had been missed.
Auto-instrumentation is awesome
As a CLI which heavily relies on interactions with an SQLite database, and HTTP APIs, I wanted to make sure that these areas were well instrumented, preferably in a way that didn't involve me having to do the work manually.
Instead of needing to add custom instrumentation for each function that called out to external APIs, or to generate the relevant Spans in generated code from sqlc or oapi-codegen, I ended up finding that I could sidestep this by using otelhttp, which would automagically instrument all HTTP calls, and even report when hitting a 4xx or 5xx status code and mark it as an error!
For SQL I used github.com/XSAM/otelsql which was also super easy to hook in, at the point that the database is opened for read/write.
Semantic Conventions are good
I started off by writing my custom instrumentation with some arbitrary attribute names that made sense to me.
As I started learning how OTel works, I then discovered that the Semantic Conventions already contained a consistent way of describing the terms I wanted to use, as well as making them more consistent with usage elsewhere across folks' observability stack.
In the process of refactoring the attribute usage, I also found that it was better to store them as an attribute.Key, which makes them easier to work with in code.
You should make your own Semantic Conventions
As well as the inbuilt attributes, I found that there were a number of things that were specific to dependency-management-data that I wanted to define.
Additionally, there were a few attributes for other tools/services that interacted with where there wasn't an existing Semantic Convention, so I (locally) defined my own on their behalf.
This has led me to the following snippet of code:
// these are custom attributes in `dmd`'s codebase
const (
	AttributeKeyCobraCommand                 attribute.Key = "cobra.command"
	AttributeKeyCobraSubcommand              attribute.Key = "cobra.subcommand"
	AttributeKeyCobraCommandPath             attribute.Key = "cobra.commandpath"

	AttributeKeyDMDDependenciesCount         attribute.Key = "dmd.dependencies.count"
	AttributeKeyDMDDatabaseMetadataFinalised attribute.Key = "dmd.dbmeta.finalised"

	AttributeKeyEndoflifedateProduct         attribute.Key = "endoflifedate.product"
	AttributeKeyEndoflifedateCycle           attribute.Key = "endoflifedate.cycle"

	AttributeKeyEcosystemsPurl               attribute.Key = "ecosystems.purl"
	AttributeKeyEcosystemsVersion            attribute.Key = "ecosystems.version"

	AttributeKeyFilesCount                   attribute.Key = "files.count"
)
These aren't necessarily owned by the dmd CLI itself, and so are attributes that I'll look to upstream, via the owning project.
Incremental improvements are great
For the majority of my testing, I was using Jaeger's OTel support to locally validate my OTel implementation, and I must say there was a fun dopamine hit of going from 0 spans, to 1, to seeing more and more of the application start to be picked up and wired in correctly.
"Missing parent span"s 🤔
As mentioned above, I've been using Jaeger to perform local testing, and it seemed to be showing the application working as expected.
Before getting ready to merge the code, I thought I'd also put the data into Honeycomb to see how they visualised the data, as well because I'd never used Honeycomb.
It turns out that there are a number of traces that are missing the parent Span 🤔 which means they don't display correctly in the UI.
It's not super clear - to me - exactly which traces these are, and why they're missing their parent, but I assume it's that the automagic instrumentation has picked up something that isn't wrapped in a parent Span, but it could be something to do with how the per-command Span is set up?
One to investigate further 🤔
Some fairly repetitive work
There was a fair bit of repetitive work with adding OpenTelemetry, so it worked quite nicely being something to do on the sofa while watching TV, as I largely didn't need to think too hard.
Although I'd only planned to start instrumenting a portion of the codebase, it was straightforward and repetitive enough that I found i.e. setting up tracing with Spans, or prefactoring to add context.Contexts everywhere was something that it made sense to do all in one go.
Not a lot of deep custom instrumentation, yet
I've not yet done some in-depth instrumentation, as I wanted to add more high-level instrumentation to start with.
There are a few parts of dmd that are more instrumented than others, as I've been digging into how OTel works, but there are others where they have the overarching Span for the command and that's it.
I've also not yet set up any metrics, and everything is managed through attributes for now, but will change in the future.
Wiring in the right protocol is a bit annoying
When setting up the Go SDK, I've found that wiring in the right exporter protocol - based on environment variabls - is a little awkward.
This is a little on me, as I want to support as much as I can out-of-the-box, but it does make things a little bit more difficult, and doesn't seem to be overly documented with a good way to do it.
A note from my colleague Andrew noted that there's the autoexport package that simplifies this 🤞🏼
Telemetry shouldn't impact developer/user experience
Although the telemetry and observability into the tooling is very useful, we shouldn't be at odds with our user experience.
For instance, let's say we have dmd help which takes 0.01s to execute, and the telemetry can take up to 5 seconds to send telemetry data.
Do we really care that much about the data that we want to collect that we're willing to sacrifice the experience for our users, where they could be waiting for a few orders of magnitude longer than the command they ran took? Probably not.
This is something that'll be application specific, and probably want to be tuned via environment variable if you're a little more focussed on keeping the data, or a user knows they're on a more unstable network connection.
Alternatively, you could cache the telemetry data to disk, and periodically send it in the background, so you can catch up on data from previous sessions, if you want to attempt to measure as much data as possible.
(Thanks to Shay for asking on Slack and reminding me of this!)
Help wanted
Too many spans
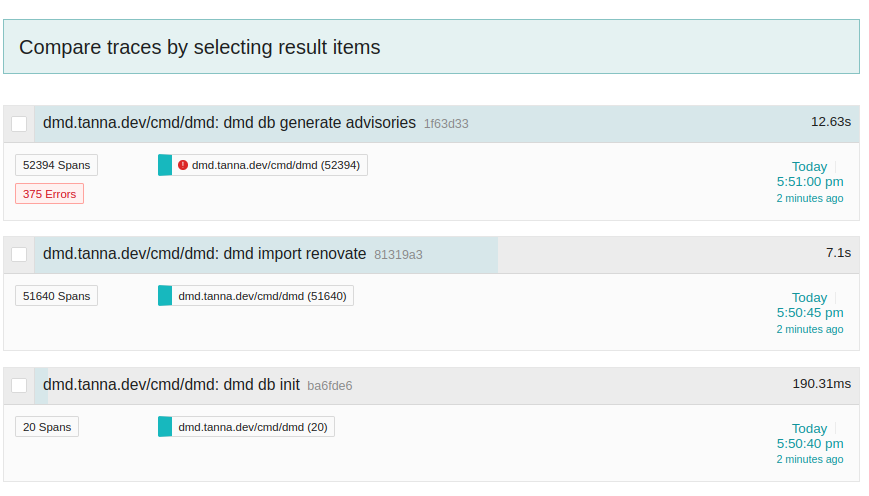
I'm wondering if the way I've split up my Spans is a little too fine-grained, given running against my example project results in ~50k Spans for some of the key operations:

Thoughts? Is this something I should fix on my side, or that would be something that the OTel Collector can be modified to only pull what's important?
Example
What do the overall changes look like?
The code changes themselves can be seen in this Merge Request, in which there's all the prefactoring, addition of the custom instrumentation, and a couple of other fixes / tweaks noticed as part of the work.
As ever with my Git-based work, I'd recommend reviewing it commit-by-commit.
This is just the start
I'm fairly happy with my first stab at this, and am looking forward to improving it over time, as well as using it to actually understand how the CLI is running, rather than making best guesses on what I think is going on.
I'm looking forward to my users using the new functionality, too! There'll be more custom instrumentation, metrics, and more coming in the future.
