Tweaking Gatling HighCharts Response Time Bounds

It feels that since I've moved to having a Fat/Uber- Jar for my Gatling tests, the reports that Gatling produces haven't quite looked the same.
It turns out that the response times boundaries were a little off and were defaulting to 800ms and 1200ms for the lowest and highest bound respectively. This was odd, as each of the API calls was well within that threshold.
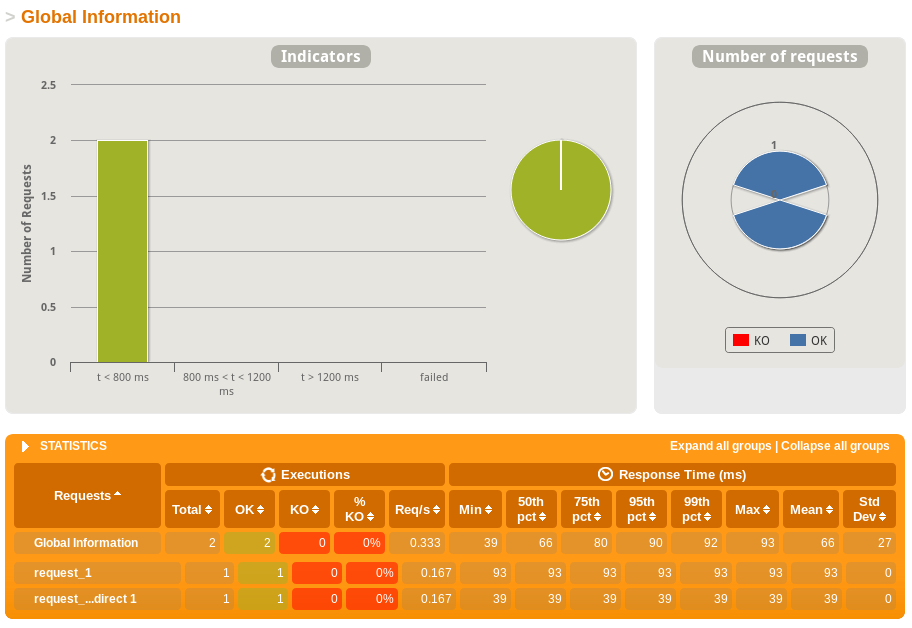
This meant that the graph and results weren't really that effective:
================================================================================
---- Global Information --------------------------------------------------------
> request count                                          2 (OK=2      KO=0     )
> min response time                                     39 (OK=39     KO=-     )
> max response time                                     93 (OK=93     KO=-     )
> mean response time                                    66 (OK=66     KO=-     )
> std deviation                                         27 (OK=27     KO=-     )
> response time 50th percentile                         66 (OK=66     KO=-     )
> response time 75th percentile                         80 (OK=80     KO=-     )
> response time 95th percentile                         90 (OK=90     KO=-     )
> response time 99th percentile                         92 (OK=92     KO=-     )
> mean requests/sec                                  0.333 (OK=0.333  KO=-     )
---- Response Time Distribution ------------------------------------------------
> t < 800 ms                                             2 (100%)
> 800 ms < t < 1200 ms                                   0 (  0%)
> t > 1200 ms                                            0 (  0%)
> failed                                                 0 (  0%)
================================================================================
This makes the charts pretty useless, as all the responses are under 800ms, so they're then just within that bound:
I did some searching, but couldn't find much that documented why I'd be seeing this. I eventually landed on the gatling-defaults.conf in the source of gatling-core and found that I needed to tweak these values in my project's gatling.conf to override the defaults:
# src/main/resources/gatling.conf
# OR
# src/test/resources/gatling.conf
gatling {
  charting {
    indicators {
      lowerBound = 25
      higherBound = 50
    }
  }
}
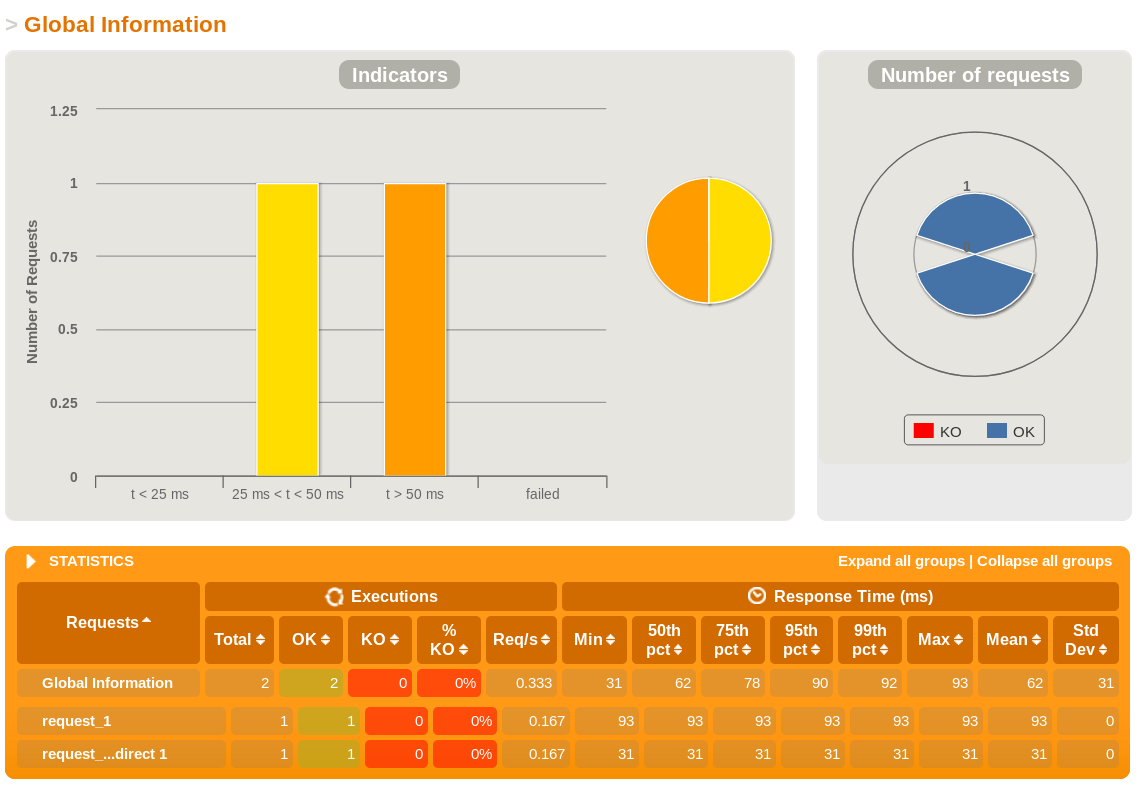
Once this was done, the console output correctly split the response times within our bounds:
=================================================================================
---- Global Information --------------------------------------------------------
> request count                                          2 (OK=2      KO=0     )
> min response time                                     33 (OK=33     KO=-     )
> max response time                                    114 (OK=114    KO=-     )
> mean response time                                    74 (OK=74     KO=-     )
> std deviation                                         41 (OK=41     KO=-     )
> response time 50th percentile                         74 (OK=74     KO=-     )
> response time 75th percentile                         94 (OK=94     KO=-     )
> response time 95th percentile                        110 (OK=110    KO=-     )
> response time 99th percentile                        113 (OK=113    KO=-     )
> mean requests/sec                                  0.333 (OK=0.333  KO=-     )
---- Response Time Distribution ------------------------------------------------
> t < 25 ms                                              0 (  0%)
> 25 ms < t < 50 ms                                      1 ( 50%)
> t > 50 ms                                              1 ( 50%)
> failed                                                 0 (  0%)
===============================================================================
As well as doing the same within the report:
 .
.